|
Horizons Pipelines & Energy Services Index (HOG)
|
As of March 31, 2024
|
|
(Energy Equity)
|
|
FundGrade A+
® Rating recipient
For more information about FundGrade
click here
2020
2019
2018
2017
Underlying Index
|
Solactive Pipelines & Energy Services Index
|
Inception Return
(7/14/2014)
|
5.49 %
|
|
Day High/Low
|
$10.72 / $10.69
|
|
YTD Return
|
8.72 %
|
|
52Week High/Low
|
$11.14 / $9.01
|
|
|
|
|
|
NAVPS
(4/18/2024)
|
$10.66
|
|
Change
|
 $-0.02 / -0.20 %
|
Open / Close
(4/18/2024)
|
$10.69
/
$10.72
|
|
|
|
Management Fee
|
0.55 %
|
|
Traded Volume
|
550
|
|
Assets ($mil)
|
-
|
|
Rank (1Yr)
|
15/60
|
|
Std Dev (3Yr)
|
32.66 %
|
|
Beta (3Yr)
|
0.59
|
|
Volatility Ranking (3Yr)
|
9/10
|
|
RRSP Eligibility
|
Yes
|
|
Open to Invest
|
Open
|
|
Annual Dividend
|
$0.41
|
|
Annual Yield
|
3.79 %
|
|
|
Objective
Horizons HOG seeks to replicate, to the extent possible, the performance of the Underlying Index, net of expenses. The Underlying Index is designed to provide exposure to equity securities of certain Canadian oil and gas companies in the Midstream Sector.
|
Fund Manager
Horizons ETFs Management (Canada) Inc.
Portfolio Manager
Horizons ETFs Management (Canada) Inc.
Sub-Advisor
Data not available
|
|
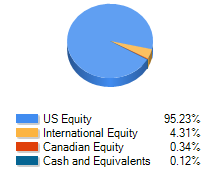
Asset Allocation
(As of March 31, 2024)
|
Sector Allocation
(As of March 31, 2024)
|
Geographic Allocation
(As of March 31, 2024)
|
Top 10 Holdings
| Name | Asset | Sector | Geographic | Percent |
| Tidewater Midstream Infrastructure Ltd | Canadian Equity | Utilities | Canada | 8.61% |
| MATTR CORP | Canadian Equity | Other | Canada | 8.44% |
| Keyera Corp | Canadian Equity | Energy | Canada | 8.42% |
| Gibson Energy Inc | Canadian Equity | Energy | Canada | 8.33% |
| AltaGas Ltd | Canadian Equity | Utilities | Canada | 8.27% |
| Enbridge Inc | Canadian Equity | Energy | Canada | 8.25% |
| TC Energy Corp | Canadian Equity | Energy | Canada | 8.23% |
| Mullen Group Ltd | Canadian Equity | Energy | Canada | 8.23% |
| Pembina Pipeline Corp | Canadian Equity | Energy | Canada | 8.17% |
| Parkland Fuel Corp | Canadian Equity | Energy | Canada | 7.93% |
Performance Data
(As of March 31, 2024)
|
|
Return (%)
|
Annualized Return (%)
|
|
Return
|
1
Mth
|
3
Mth
|
6
Mth
|
YTD
|
1
Yr
|
3
Yr
|
5
Yr
|
10
Yr
|
|
Fund
|
3.48
|
8.72
|
14.68
|
8.72
|
22.28
|
14.99
|
8.60
|
-
|
|
Benchmark
|
9.34
|
18.93
|
8.16
|
18.93
|
29.32
|
39.85
|
17.70
|
3.00
|
|
Quartile Ranking
|
4
|
4
|
1
|
4
|
1
|
4
|
3
|
-
|
|
Calendar Return (%)
|
2023
|
2022
|
2021
|
2020
|
2019
|
2018
|
2017
|
2016
|
2015
|
2014
|
|
Fund
|
9.09
|
15.94
|
34.59
|
-17.96
|
20.48
|
-12.07
|
-2.17
|
39.01
|
-25.14
|
-
|
|
Benchmark
|
4.14
|
54.02
|
85.18
|
-34.64
|
9.75
|
-26.57
|
-10.61
|
39.64
|
-24.13
|
-16.34
|
|
Quartile Ranking
|
1
|
4
|
3
|
1
|
1
|
1
|
1
|
2
|
3
|
-
|