|
Brompton North American Financials Div ETF(BFIN.U)
|
As of March 31, 2024
|
|
(Financial Services Equity)
|
|
Underlying Index
|
|
Inception Return
(8/8/2019)
|
8.64 %
|
|
Day High/Low
|
- / -
|
|
YTD Return
|
10.75 %
|
|
52Week High/Low
|
$22.99 / $17.44
|
|
|
|
|
|
NAVPS
(4/18/2024)
|
$21.77
|
|
Change
|
 $0.12 / 0.56 %
|
Open / Close
(4/18/2024)
|
-
/
$21.65
|
|
|
|
Management Fee
|
0.75 %
|
|
Traded Volume
|
0
|
|
Assets ($mil)
|
-
|
|
Rank (1Yr)
|
-
|
|
Std Dev (3Yr)
|
-
|
|
Beta (3Yr)
|
-
|
|
Volatility Ranking (3Yr)
|
10/10
|
|
RRSP Eligibility
|
Yes
|
|
Open to Invest
|
Open
|
|
Annual Dividend
|
$1.30
|
|
Annual Yield
|
6.00 %
|
|
|
Objective
Provides: (a) stable monthly cash distributions; (b) opportunity for capital appreciation; and (c) lower overall volatility of portfolio returns than otherwise experienced by owning securities of North American Financial Services Companies directly.
|
Fund Manager
Brompton Funds Limited
Portfolio Manager
Brompton Funds Limited
Sub-Advisor
Data not available
|
|
Asset Allocation
(As of March 31, 2024)
|
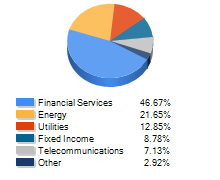
Sector Allocation
(As of March 31, 2024)
|
Geographic Allocation
(As of March 31, 2024)
|
Top 10 Holdings
| Name | Asset | Sector | Geographic | Percent |
| JPMorgan Chase & Co | US Equity | Financial Services | United States | 7.97% |
| Berkshire Hathaway Inc Cl B | US Equity | Financial Services | United States | 7.32% |
| Ameriprise Financial Inc | US Equity | Financial Services | United States | 6.97% |
| Manulife Financial Corp | Canadian Equity | Financial Services | Canada | 6.06% |
| Bank of America Corp | US Equity | Financial Services | United States | 5.51% |
| Morgan Stanley | US Equity | Financial Services | United States | 5.37% |
| Royal Bank of Canada | Canadian Equity | Financial Services | Canada | 5.33% |
| Synchrony Financial | US Equity | Financial Services | United States | 5.21% |
| Wells Fargo & Co | US Equity | Financial Services | United States | 5.14% |
| Raymond James Financial Inc | US Equity | Financial Services | United States | 5.11% |
Performance Data
(As of March 31, 2024)
|
|
Return (%)
|
Annualized Return (%)
|
|
Return
|
1
Mth
|
3
Mth
|
6
Mth
|
YTD
|
1
Yr
|
3
Yr
|
5
Yr
|
10
Yr
|
|
Fund
|
5.38
|
10.75
|
23.83
|
10.75
|
26.23
|
4.00
|
-
|
-
|
|
Benchmark
|
3.91
|
7.24
|
21.09
|
7.24
|
25.52
|
7.10
|
8.24
|
6.74
|
|
Quartile Ranking
|
-
|
-
|
-
|
-
|
-
|
-
|
-
|
-
|
|
Calendar Return (%)
|
2023
|
2022
|
2021
|
2020
|
2019
|
2018
|
2017
|
2016
|
2015
|
2014
|
|
Fund
|
9.27
|
-19.75
|
31.31
|
3.08
|
-
|
-
|
-
|
-
|
-
|
-
|
|
Benchmark
|
16.13
|
-11.71
|
22.57
|
-3.34
|
25.45
|
-12.63
|
23.37
|
9.58
|
-4.13
|
4.69
|
|
Quartile Ranking
|
-
|
-
|
-
|
-
|
-
|
-
|
-
|
-
|
-
|
-
|