|
BMO MSCI Europe High Quality Hgd C$ Idx ETF (ZEQ)
|
As of March 31, 2024
|
|
(European Equity)
|
|
FundGrade A+
® Rating recipient
For more information about FundGrade
click here
2022
2021
2020
2019
Underlying Index
|
MSCI Europe Quality 100% Hedged to CAD Index
|
Inception Return
(2/10/2014)
|
10.01 %
|
|
Day High/Low
|
$30.75 / $30.55
|
|
YTD Return
|
7.51 %
|
|
52Week High/Low
|
$31.41 / $26.19
|
|
|
|
|
|
NAVPS
(4/22/2024)
|
$30.65
|
|
Change
|
 $0.36 / 1.17 %
|
Open / Close
(4/22/2024)
|
$30.61
/
$30.69
|
|
|
|
Management Fee
|
0.40 %
|
|
Traded Volume
|
2,280
|
|
Assets ($mil)
|
$783.83
|
|
Rank (1Yr)
|
74/112
|
|
Std Dev (3Yr)
|
14.19 %
|
|
Beta (3Yr)
|
0.86
|
|
Volatility Ranking (3Yr)
|
8/10
|
|
RRSP Eligibility
|
Yes
|
|
Open to Invest
|
Open
|
|
Annual Dividend
|
$0.73
|
|
Annual Yield
|
2.38 %
|
|
|
Objective
BMO MSCI Europe High Quality Hedged to CAD Index ETF has been designed to replicate, to the extent possible, the performance of the MSCI Europe Quality 100% Hedged to CAD Index, net of expenses.
|
Fund Manager
BMO Asset Management Inc.
Portfolio Manager
BMO Asset Management Inc.
Sub-Advisor
Data not available
|
|
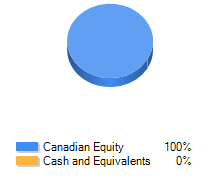
Asset Allocation
(As of March 31, 2024)
|
Sector Allocation
(As of March 31, 2024)
|
Geographic Allocation
(As of March 31, 2024)
|
Top 10 Holdings
| Name | Asset | Sector | Geographic | Percent |
| ASML Holding NV | International Equity | Technology | European Union | 6.24% |
| Novo Nordisk A/S Cl B | International Equity | Healthcare | European Union | 5.53% |
| LVMH Moet Hennessy Louis Vuitton SE | International Equity | Consumer Goods | European Union | 5.15% |
| AstraZeneca PLC | International Equity | Healthcare | European Union | 4.77% |
| Novartis AG Cl N | International Equity | Healthcare | Other European | 4.55% |
| Nestle SA Cl N | International Equity | Consumer Goods | Other European | 4.28% |
| Roche Holding AG - Partcptn | International Equity | Healthcare | Other European | 4.07% |
| Unilever PLC | International Equity | Consumer Goods | European Union | 3.43% |
| L'Oreal SA | International Equity | Consumer Goods | European Union | 2.92% |
| Schneider Electric SE | International Equity | Industrial Goods | European Union | 2.70% |
Performance Data
(As of March 31, 2024)
|
|
Return (%)
|
Annualized Return (%)
|
|
Return
|
1
Mth
|
3
Mth
|
6
Mth
|
YTD
|
1
Yr
|
3
Yr
|
5
Yr
|
10
Yr
|
|
Fund
|
2.20
|
7.51
|
15.18
|
7.51
|
11.67
|
9.06
|
10.88
|
9.79
|
|
Benchmark
|
3.63
|
7.29
|
17.28
|
7.29
|
14.30
|
8.05
|
8.07
|
6.69
|
|
Quartile Ranking
|
3
|
1
|
3
|
1
|
3
|
1
|
1
|
1
|
|
Calendar Return (%)
|
2023
|
2022
|
2021
|
2020
|
2019
|
2018
|
2017
|
2016
|
2015
|
2014
|
|
Fund
|
14.85
|
-11.74
|
24.22
|
6.58
|
32.88
|
-6.41
|
14.80
|
5.80
|
9.68
|
-
|
|
Benchmark
|
17.51
|
-10.82
|
15.26
|
3.59
|
19.54
|
-7.68
|
18.15
|
-3.54
|
17.20
|
3.06
|
|
Quartile Ranking
|
4
|
2
|
1
|
3
|
1
|
1
|
3
|
1
|
4
|
-
|