|
BMO High Yield US Corp Bond Hgd to C$ Ix ETF (ZHY)
|
As of March 31, 2024
|
|
(High Yield Fixed Income)
|
|
FundGrade A+
® Rating recipient
For more information about FundGrade
click here
Underlying Index
|
Bloomberg Barclays U.S. High Yield Very Liquid Index CAD Hedged
|
Inception Return
(10/26/2009)
|
4.60 %
|
|
Day High/Low
|
$10.89 / $10.86
|
|
YTD Return
|
0.94 %
|
|
52Week High/Low
|
$11.25 / $10.25
|
|
|
|
|
|
NAVPS
(4/18/2024)
|
$10.89
|
|
Change
|
 $0.00 / 0.01 %
|
Open / Close
(4/18/2024)
|
$10.86
/
$10.88
|
|
|
|
Management Fee
|
0.55 %
|
|
Traded Volume
|
8,779
|
|
Assets ($mil)
|
-
|
|
Rank (1Yr)
|
79/294
|
|
Std Dev (3Yr)
|
9.25 %
|
|
Beta (3Yr)
|
1.00
|
|
Volatility Ranking (3Yr)
|
4/10
|
|
RRSP Eligibility
|
Yes
|
|
Open to Invest
|
Open
|
|
Annual Dividend
|
$0.72
|
|
Annual Yield
|
6.62 %
|
|
|
Objective
The BMO High Yield US Corporate Bond Hedged to CAD Index ETF has been designed to replicate, to the extent possible, the performance of the Barclays Capital U.S. High Yield Very Liquid Index CAD Hedged net of expenses.
|
Fund Manager
BMO Asset Management Inc.
Portfolio Manager
BMO Asset Management Inc.
Sub-Advisor
Data not available
|
|
Asset Allocation
(As of March 31, 2024)
|
Sector Allocation
(As of March 31, 2024)
|
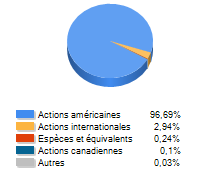
Geographic Allocation
(As of March 31, 2024)
|
Top 10 Holdings
| Name | Asset | Sector | Geographic | Percent |
| BMO High Yield US Corporate Bond Index ETF (ZJK) | Foreign Bonds | Fixed Income | United States | 99.84% |
| CAD Currency Forward | Cash and Equivalents | Cash and Cash Equivalent | Canada | 0.20% |
| CANADIAN DOLLAR | Cash and Equivalents | Cash and Cash Equivalent | Canada | 0.08% |
| CEVA HOLDINGS LLC A 2 PFD | International Equity | Industrial Services | European Union | 0.03% |
| CEVA HOLDINGS LLC | Foreign Bonds | Fixed Income | United States | 0.02% |
| US DOLLAR | Cash and Equivalents | Cash and Cash Equivalent | United States | 0.00% |
| USD Currency Forward | Cash and Equivalents | Cash and Cash Equivalent | United States | -0.17% |
Performance Data
(As of March 31, 2024)
|
|
Return (%)
|
Annualized Return (%)
|
|
Return
|
1
Mth
|
3
Mth
|
6
Mth
|
YTD
|
1
Yr
|
3
Yr
|
5
Yr
|
10
Yr
|
|
Fund
|
1.03
|
0.94
|
8.15
|
0.94
|
9.69
|
0.75
|
2.21
|
2.52
|
|
Benchmark
|
0.83
|
4.14
|
9.32
|
4.14
|
11.08
|
2.94
|
3.41
|
5.66
|
|
Quartile Ranking
|
2
|
4
|
2
|
4
|
2
|
3
|
3
|
3
|
|
Calendar Return (%)
|
2023
|
2022
|
2021
|
2020
|
2019
|
2018
|
2017
|
2016
|
2015
|
2014
|
|
Fund
|
12.34
|
-12.76
|
3.72
|
2.89
|
13.62
|
-4.20
|
5.40
|
14.71
|
-6.70
|
1.71
|
|
Benchmark
|
10.36
|
-6.92
|
0.50
|
6.14
|
7.98
|
5.36
|
2.96
|
10.80
|
14.93
|
8.91
|
|
Quartile Ranking
|
1
|
4
|
3
|
3
|
1
|
4
|
2
|
2
|
4
|
4
|