|
Caldwell U.S. Dividend Adv Fd ETF Units (UDA)
|
As of March 31, 2024
|
|
(U.S. Equity)
|
|
Underlying Index
|
|
Inception Return
(3/18/2020)
|
15.57 %
|
|
Day High/Low
|
$15.70 / $15.70
|
|
YTD Return
|
19.32 %
|
|
52Week High/Low
|
$16.53 / $12.97
|
|
|
|
|
|
NAVPS
(4/18/2024)
|
$15.58
|
|
Change
|
 $-0.20 / -1.27 %
|
Open / Close
(4/18/2024)
|
$15.70
/
$15.70
|
|
|
|
Management Fee
|
0.75 %
|
|
Traded Volume
|
812
|
|
Assets ($mil)
|
-
|
|
Rank (1Yr)
|
1041/1288
|
|
Std Dev (3Yr)
|
-
|
|
Beta (3Yr)
|
-
|
|
Volatility Ranking (3Yr)
|
6/10
|
|
RRSP Eligibility
|
Yes
|
|
Open to Invest
|
Open
|
|
Annual Dividend
|
$0.46
|
|
Annual Yield
|
2.90 %
|
|
|
Objective
The fundamental investment objective of the Fund is to provide unitholders with: (i) monthly distributions; and (ii) the potential for capital appreciation and enhanced long-term risk adjusted returns. The Fund invests primarily in dividend paying equity securities of U.S. domiciled issuers or issuers that derive a significant portion of their revenue or earnings from the U.S.
|
Fund Manager
Caldwell Investment Management Ltd.
Portfolio Manager
Caldwell Investment Management Ltd.
Sub-Advisor
Data not available
|
|
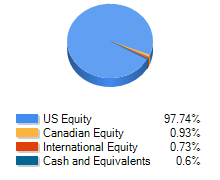
Asset Allocation
(As of March 31, 2024)
|
Sector Allocation
(As of March 31, 2024)
|
Geographic Allocation
(As of March 31, 2024)
|
Top 10 Holdings
| Name | Asset | Sector | Geographic | Percent |
| Mastercard Inc Cl A | US Equity | Financial Services | United States | 6.81% |
| Comfort Systems USA Inc | US Equity | Industrial Goods | United States | 6.50% |
| Quanta Services Inc | US Equity | Real Estate | United States | 6.30% |
| Broadcom Inc | US Equity | Technology | United States | 6.22% |
| Booz Allen Hamilton Holding Corp Cl A | US Equity | Technology | United States | 6.07% |
| Costco Wholesale Corp | US Equity | Consumer Services | United States | 5.99% |
| Microsoft Corp | US Equity | Technology | United States | 5.66% |
| Parker-Hannifin Corp | US Equity | Industrial Goods | United States | 5.52% |
| Eli Lilly and Co | US Equity | Healthcare | United States | 5.46% |
| Entegris Inc | US Equity | Technology | United States | 5.09% |
Performance Data
(As of March 31, 2024)
|
|
Return (%)
|
Annualized Return (%)
|
|
Return
|
1
Mth
|
3
Mth
|
6
Mth
|
YTD
|
1
Yr
|
3
Yr
|
5
Yr
|
10
Yr
|
|
Fund
|
2.97
|
19.32
|
21.75
|
19.32
|
20.86
|
10.48
|
-
|
-
|
|
Benchmark
|
3.07
|
13.26
|
23.76
|
13.26
|
30.04
|
14.30
|
15.37
|
15.28
|
|
Quartile Ranking
|
2
|
1
|
3
|
1
|
4
|
3
|
-
|
-
|
|
Calendar Return (%)
|
2023
|
2022
|
2021
|
2020
|
2019
|
2018
|
2017
|
2016
|
2015
|
2014
|
|
Fund
|
0.87
|
-4.58
|
22.19
|
-
|
-
|
-
|
-
|
-
|
-
|
-
|
|
Benchmark
|
23.32
|
-12.52
|
28.16
|
16.07
|
25.18
|
3.98
|
13.80
|
8.65
|
20.77
|
24.19
|
|
Quartile Ranking
|
4
|
1
|
3
|
-
|
-
|
-
|
-
|
-
|
-
|
-
|