|
Harvest Global Gold Giants Index ETF (HGGG)
|
As of March 31, 2024
|
|
(Precious Metals Equity)
|
|
Underlying Index
|
Solactive Global Gold Giants Index TR
|
Inception Return
(1/10/2019)
|
7.37 %
|
|
Day High/Low
|
- / -
|
|
YTD Return
|
1.30 %
|
|
52Week High/Low
|
$31.58 / $21.87
|
|
|
|
|
|
NAVPS
(4/18/2024)
|
$29.04
|
|
Change
|
 $-0.01 / -0.02 %
|
Open / Close
(4/18/2024)
|
-
/
$29.13
|
|
|
|
Management Fee
|
0.40 %
|
|
Traded Volume
|
0
|
|
Assets ($mil)
|
$14.11
|
|
Rank (1Yr)
|
67/77
|
|
Std Dev (3Yr)
|
33.26 %
|
|
Beta (3Yr)
|
0.93
|
|
Volatility Ranking (3Yr)
|
10/10
|
|
RRSP Eligibility
|
Yes
|
|
Open to Invest
|
Open
|
|
Annual Dividend
|
-
|
|
Annual Yield
|
-
|
|
|
Objective
The ETF seeks to replicate, to the extent reasonably possible and before fees and expenses, the performance of the Solactive Global Gold Giants Index TR. The Harvest Global Gold Giants Index ETF primarily invests in large gold mining issuers that are listed on a regulated stock exchange in North America, Australia or in certain European countries.
|
Fund Manager
Harvest Portfolios Group Inc.
Portfolio Manager
Paul G. MacDonald, Harvest Portfolios Group Inc.
Sub-Advisor
Data not available
|
|
Asset Allocation
(As of March 31, 2024)
|
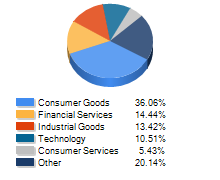
Sector Allocation
(As of March 31, 2024)
|
Geographic Allocation
(As of March 31, 2024)
|
Top 10 Holdings
| Name | Asset | Sector | Geographic | Percent |
| Equinox Gold Corp | Canadian Equity | Basic Materials | Canada | 5.59% |
| Perseus Mining Ltd | International Equity | Basic Materials | Asia/Pacific Rim | 5.33% |
| AngloGold Ashanti Ltd | International Equity | Basic Materials | Africa and Middle East | 5.33% |
| Alamos Gold Inc Cl A | Canadian Equity | Basic Materials | Canada | 5.30% |
| Eldorado Gold Corp | Canadian Equity | Basic Materials | Canada | 5.26% |
| Endeavour Mining PLC | International Equity | Basic Materials | European Union | 5.23% |
| Kinross Gold Corp | Canadian Equity | Basic Materials | Canada | 5.23% |
| Centamin PLC | International Equity | Basic Materials | European Union | 5.18% |
| Agnico Eagle Mines Ltd | Canadian Equity | Basic Materials | Canada | 5.18% |
| Lundin Gold Inc | Canadian Equity | Basic Materials | Canada | 5.11% |
Performance Data
(As of March 31, 2024)
|
|
Return (%)
|
Annualized Return (%)
|
|
Return
|
1
Mth
|
3
Mth
|
6
Mth
|
YTD
|
1
Yr
|
3
Yr
|
5
Yr
|
10
Yr
|
|
Fund
|
21.17
|
1.30
|
13.69
|
1.30
|
-5.66
|
2.37
|
6.81
|
-
|
|
Benchmark
|
18.87
|
2.02
|
15.68
|
2.02
|
-5.10
|
0.90
|
9.72
|
5.03
|
|
Quartile Ranking
|
1
|
4
|
4
|
4
|
4
|
3
|
4
|
-
|
|
Calendar Return (%)
|
2023
|
2022
|
2021
|
2020
|
2019
|
2018
|
2017
|
2016
|
2015
|
2014
|
|
Fund
|
4.02
|
-4.43
|
-10.11
|
28.99
|
-
|
-
|
-
|
-
|
-
|
-
|
|
Benchmark
|
1.85
|
-2.48
|
-7.16
|
25.38
|
42.02
|
-3.46
|
0.96
|
55.11
|
-17.99
|
-14.81
|
|
Quartile Ranking
|
3
|
1
|
4
|
3
|
-
|
-
|
-
|
-
|
-
|
-
|