|
Brompton Tech Leaders Income ETF (TLF)
|
As of March 31, 2024
|
|
(Sector Equity)
|
|
Underlying Index
|
|
Inception Return
(5/20/2011)
|
14.39 %
|
|
Day High/Low
|
$22.79 / $22.45
|
|
YTD Return
|
11.54 %
|
|
52Week High/Low
|
$24.22 / $16.92
|
|
|
|
|
|
NAVPS
(4/24/2024)
|
$22.55
|
|
Change
|
 $-0.03 / -0.13 %
|
Open / Close
(4/24/2024)
|
$22.64
/
$22.58
|
|
|
|
Management Fee
|
0.75 %
|
|
Traded Volume
|
2,070
|
|
Assets ($mil)
|
$131.37
|
|
Rank (1Yr)
|
41/177
|
|
Std Dev (3Yr)
|
20.51 %
|
|
Beta (3Yr)
|
1.00
|
|
Volatility Ranking (3Yr)
|
10/10
|
|
RRSP Eligibility
|
Yes
|
|
Open to Invest
|
Open
|
|
Annual Dividend
|
$1.21
|
|
Annual Yield
|
5.37 %
|
|
|
Objective
The investment objectives of TLF are to provide TLF Unitholders with: (i) stable monthly cash distributions; (ii) the opportunity for capital appreciation; and (iii) lower overall volatility of portfolio returns than would otherwise be experienced by owning securities of Technology Companies directly. TLF seeks to hedge substantially all of its exposure to foreign currencies back to the Canadian dollar.
|
Fund Manager
Brompton Funds Limited
Portfolio Manager
Laura Lau, Brompton Funds Limited
Michael Clare, Brompton Funds Limited
Sub-Advisor
Data not available
|
|
Asset Allocation
(As of March 31, 2024)
|
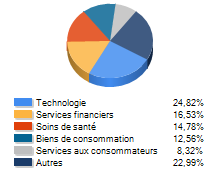
Sector Allocation
(As of March 31, 2024)
|
Geographic Allocation
(As of March 31, 2024)
|
Top 10 Holdings
| Name | Asset | Sector | Geographic | Percent |
| NVIDIA Corp | US Equity | Technology | United States | 5.85% |
| Meta Platforms Inc Cl A | US Equity | Technology | United States | 5.12% |
| ServiceNow Inc | US Equity | Technology | United States | 5.07% |
| Microsoft Corp | US Equity | Technology | United States | 4.83% |
| Apple Inc | US Equity | Technology | United States | 4.79% |
| Applied Materials Inc | US Equity | Technology | United States | 4.52% |
| Broadcom Inc | US Equity | Technology | United States | 4.49% |
| Advanced Micro Devices Inc | US Equity | Technology | United States | 4.28% |
| Salesforce Inc | US Equity | Technology | United States | 4.24% |
| Micron Technology Inc | US Equity | Technology | United States | 4.19% |
Performance Data
(As of March 31, 2024)
|
|
Return (%)
|
Annualized Return (%)
|
|
Return
|
1
Mth
|
3
Mth
|
6
Mth
|
YTD
|
1
Yr
|
3
Yr
|
5
Yr
|
10
Yr
|
|
Fund
|
1.24
|
11.54
|
28.32
|
11.54
|
41.92
|
13.71
|
19.69
|
15.70
|
|
Benchmark
|
4.14
|
6.62
|
15.26
|
6.62
|
13.96
|
9.11
|
9.96
|
7.67
|
|
Quartile Ranking
|
3
|
2
|
2
|
2
|
1
|
1
|
1
|
2
|
|
Calendar Return (%)
|
2023
|
2022
|
2021
|
2020
|
2019
|
2018
|
2017
|
2016
|
2015
|
2014
|
|
Fund
|
47.94
|
-29.10
|
30.38
|
38.36
|
37.21
|
4.02
|
34.40
|
8.35
|
-13.32
|
15.32
|
|
Benchmark
|
11.75
|
-5.84
|
25.09
|
5.60
|
22.88
|
-8.89
|
9.10
|
21.08
|
-8.32
|
10.55
|
|
Quartile Ranking
|
1
|
3
|
1
|
2
|
1
|
2
|
1
|
2
|
4
|
4
|