|
Horizons Big Data & Hardware Index ETF (HBGD)
|
As of March 31, 2024
|
|
(Sector Equity)
|
|
Underlying Index
|
Solactive Blockchain Technology & Hardware Index
|
Inception Return
(6/20/2018)
|
24.55 %
|
|
Day High/Low
|
$26.11 / $25.69
|
|
YTD Return
|
5.15 %
|
|
52Week High/Low
|
$29.99 / $15.40
|
|
|
|
|
|
NAVPS
(4/24/2024)
|
$25.70
|
|
Change
|
 $0.03 / 0.12 %
|
Open / Close
(4/24/2024)
|
$26.11
/
$25.69
|
|
|
|
Management Fee
|
0.65 %
|
|
Traded Volume
|
511
|
|
Assets ($mil)
|
-
|
|
Rank (1Yr)
|
1/177
|
|
Std Dev (3Yr)
|
39.92 %
|
|
Beta (3Yr)
|
1.38
|
|
Volatility Ranking (3Yr)
|
10/10
|
|
RRSP Eligibility
|
Yes
|
|
Open to Invest
|
Open
|
|
Annual Dividend
|
$0.17
|
|
Annual Yield
|
0.67 %
|
|
|
Objective
The ETF seeks to replicate, to the extent possible, the performance of the Solactive Blockchain Technology & Hardware Index (the "Underlying Index"), net of expenses. The Underlying Index tracks a portfolio of global companies focusing directly on blockchain innovation and development as well as companies providing hardware and hardware-related services used in the process of cryptocurrency mining.
|
Fund Manager
Horizons ETFs Management (Canada) Inc.
Portfolio Manager
Horizons ETFs Management (Canada) Inc.
Sub-Advisor
Data not available
|
|
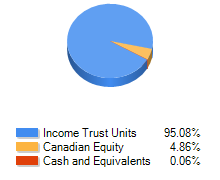
Asset Allocation
(As of March 31, 2024)
|
Sector Allocation
(As of March 31, 2024)
|
Geographic Allocation
(As of March 31, 2024)
|
Top 10 Holdings
| Name | Asset | Sector | Geographic | Percent |
| Super Micro Computer Inc | US Equity | Technology | United States | 5.36% |
| CleanSpark Inc | US Equity | Energy | United States | 4.40% |
| SAKURA INTERNET INC | International Equity | Other | Other | 3.82% |
| Coinbase Global Inc Cl A | US Equity | Financial Services | United States | 3.42% |
| ARM HOLDINGS PLC | International Equity | Other | Other | 3.21% |
| NVIDIA Corp | US Equity | Technology | United States | 2.97% |
| Cipher Mining Inc | US Equity | Financial Services | United States | 2.67% |
| Terawulf Inc | US Equity | Financial Services | United States | 2.61% |
| Dell Technologies Inc Cl C | US Equity | Technology | United States | 2.60% |
| Micron Technology Inc | US Equity | Technology | United States | 2.58% |
Performance Data
(As of March 31, 2024)
|
|
Return (%)
|
Annualized Return (%)
|
|
Return
|
1
Mth
|
3
Mth
|
6
Mth
|
YTD
|
1
Yr
|
3
Yr
|
5
Yr
|
10
Yr
|
|
Fund
|
3.36
|
5.15
|
49.73
|
5.15
|
74.99
|
1.29
|
33.36
|
-
|
|
Benchmark
|
4.14
|
6.62
|
15.26
|
6.62
|
13.96
|
9.11
|
9.96
|
7.67
|
|
Quartile Ranking
|
1
|
4
|
1
|
4
|
1
|
4
|
1
|
-
|
|
Calendar Return (%)
|
2023
|
2022
|
2021
|
2020
|
2019
|
2018
|
2017
|
2016
|
2015
|
2014
|
|
Fund
|
126.85
|
-56.20
|
57.51
|
116.63
|
44.26
|
-
|
-
|
-
|
-
|
-
|
|
Benchmark
|
11.75
|
-5.84
|
25.09
|
5.60
|
22.88
|
-8.89
|
9.10
|
21.08
|
-8.32
|
10.55
|
|
Quartile Ranking
|
1
|
4
|
1
|
1
|
1
|
-
|
-
|
-
|
-
|
-
|