|
Purpose Marijuana Opportunities Fund ETF (MJJ)
|
As of March 31, 2024
|
|
(Sector Equity)
|
|
Underlying Index
|
|
Inception Return
(1/31/2018)
|
-11.35 %
|
|
Day High/Low
|
- / -
|
|
YTD Return
|
33.58 %
|
|
52Week High/Low
|
$10.14 / $4.01
|
|
|
|
|
|
NAVPS
(4/18/2024)
|
$8.45
|
|
Change
|
 $-0.27 / -3.13 %
|
Open / Close
(4/18/2024)
|
-
/
$8.50
|
|
|
|
Management Fee
|
0.75 %
|
|
Traded Volume
|
1
|
|
Assets ($mil)
|
-
|
|
Rank (1Yr)
|
20/177
|
|
Std Dev (3Yr)
|
43.80 %
|
|
Beta (3Yr)
|
1.33
|
|
Volatility Ranking (3Yr)
|
10/10
|
|
RRSP Eligibility
|
Yes
|
|
Open to Invest
|
Open
|
|
Annual Dividend
|
$0.04
|
|
Annual Yield
|
0.47 %
|
|
|
Objective
The Fund seeks to provide unitholders with attractive long-term capital appreciation by investing in global issuers with interest in the marijuana or marijuana related industries. While the Fund will primarily invest in equity securities, it may also acquire other types of securities of publicly listed companies, including, but not limited to, ADRs, preferred shares, convertible securities, debt securities, subscription receipts, options and warrants.
|
Fund Manager
Purpose Investments Inc.
Portfolio Manager
Purpose Investments Inc.
Sub-Advisor
Data not available
|
|
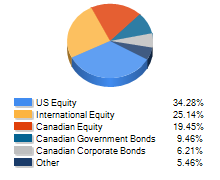
Asset Allocation
(As of March 31, 2024)
|
Sector Allocation
(As of March 31, 2024)
|
Geographic Allocation
(As of March 31, 2024)
|
Top 10 Holdings
| Name | Asset | Sector | Geographic | Percent |
| Verano Holdings Corp Cl A | US Equity | Consumer Services | United States | 18.40% |
| Green Thumb Industries Inc | US Equity | Healthcare | United States | 17.27% |
| Trulieve Cannabis Corp | US Equity | Healthcare | United States | 13.39% |
| Curaleaf Holdings Inc | Canadian Equity | Healthcare | Canada | 7.22% |
| Ayr Wellness Inc | US Equity | Healthcare | United States | 6.47% |
| Cresco Labs Inc | US Equity | Healthcare | United States | 5.65% |
| Terrascend Corp | Canadian Equity | Healthcare | Canada | 4.42% |
| Cansortium Inc | US Equity | Healthcare | United States | 4.03% |
| Ascend Wellness Holdings Inc Cl A | US Equity | Healthcare | United States | 3.97% |
| Cannabist Company Holdings Inc | US Equity | Other | United States | 2.81% |
Performance Data
(As of March 31, 2024)
|
|
Return (%)
|
Annualized Return (%)
|
|
Return
|
1
Mth
|
3
Mth
|
6
Mth
|
YTD
|
1
Yr
|
3
Yr
|
5
Yr
|
10
Yr
|
|
Fund
|
9.60
|
33.58
|
12.64
|
33.58
|
48.63
|
-37.54
|
-22.70
|
-
|
|
Benchmark
|
4.14
|
6.62
|
15.26
|
6.62
|
13.96
|
9.11
|
9.96
|
7.67
|
|
Quartile Ranking
|
1
|
1
|
3
|
1
|
1
|
4
|
4
|
-
|
|
Calendar Return (%)
|
2023
|
2022
|
2021
|
2020
|
2019
|
2018
|
2017
|
2016
|
2015
|
2014
|
|
Fund
|
-5.73
|
-68.34
|
-21.64
|
61.64
|
-14.51
|
-
|
-
|
-
|
-
|
-
|
|
Benchmark
|
11.75
|
-5.84
|
25.09
|
5.60
|
22.88
|
-8.89
|
9.10
|
21.08
|
-8.32
|
10.55
|
|
Quartile Ranking
|
4
|
4
|
4
|
1
|
4
|
-
|
-
|
-
|
-
|
-
|