|
Dynamic Active Global Finan Serv ETF (DXF)
|
As of March 31, 2024
|
|
(Financial Services Equity)
|
|
FundGrade A+
® Rating recipient
For more information about FundGrade
click here
2020
Underlying Index
|
|
Inception Return
(9/22/2017)
|
11.97 %
|
|
Day High/Low
|
- / -
|
|
YTD Return
|
10.60 %
|
|
52Week High/Low
|
$37.76 / $28.51
|
|
|
|
|
|
NAVPS
(4/22/2024)
|
$37.07
|
|
Change
|
 $0.23 / 0.63 %
|
Open / Close
(4/22/2024)
|
-
/
$36.62
|
|
|
|
Management Fee
|
0.75 %
|
|
Traded Volume
|
0
|
|
Assets ($mil)
|
-
|
|
Rank (1Yr)
|
13/71
|
|
Std Dev (3Yr)
|
20.34 %
|
|
Beta (3Yr)
|
1.03
|
|
Volatility Ranking (3Yr)
|
10/10
|
|
RRSP Eligibility
|
Yes
|
|
Open to Invest
|
Open
|
|
Annual Dividend
|
$0.73
|
|
Annual Yield
|
2.00 %
|
|
|
Objective
DXF seeks to provide long-term capital growth by investing primarily in equity securities of companies globally, with a focus in the U.S., that are involved in the financial services and/or financial technology sectors. Exposure to these types of equity securities will be obtained by investing primarily in Dynamic Active Global Financial Services Fund (the “Dynamic AGFS Fund”), and/or by investing directly in them, in securities of one or more Other Funds, and/or through the use of derivatives.
|
Fund Manager
1832 Asset Management L.P.
Portfolio Manager
Yassen Dimitrov, 1832 Asset Management L.P.
Sub-Advisor
Data not available
|
|
Asset Allocation
(As of January 31, 2024)
|
Sector Allocation
(As of January 31, 2024)
|
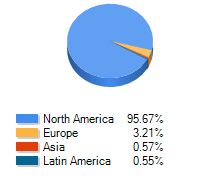
Geographic Allocation
(As of January 31, 2024)
|
Top 10 Holdings
| Name | Asset | Sector | Geographic | Percent |
| Euronext NV | International Equity | Financial Services | European Union | 5.97% |
| Partners Group Holding AG | International Equity | Financial Services | Other European | 5.44% |
| Intermediate Capital Group PLC | International Equity | Financial Services | European Union | 4.88% |
| Apollo Global Management Inc | US Equity | Financial Services | United States | 4.76% |
| Visa Inc Cl A | US Equity | Financial Services | United States | 4.74% |
| Ares Management Corp Cl A | US Equity | Financial Services | United States | 4.44% |
| Deutsche Boerse AG Cl N | International Equity | Financial Services | European Union | 4.25% |
| CME Group Inc Cl A | US Equity | Financial Services | United States | 4.03% |
| Brookfield Corp Cl A | Canadian Equity | Financial Services | Canada | 3.79% |
| Truist Financial Corp | US Equity | Financial Services | United States | 3.70% |
Performance Data
(As of March 31, 2024)
|
|
Return (%)
|
Annualized Return (%)
|
|
Return
|
1
Mth
|
3
Mth
|
6
Mth
|
YTD
|
1
Yr
|
3
Yr
|
5
Yr
|
10
Yr
|
|
Fund
|
3.07
|
10.60
|
26.12
|
10.60
|
29.36
|
7.00
|
11.84
|
-
|
|
Benchmark
|
3.76
|
9.87
|
21.36
|
9.87
|
25.68
|
9.79
|
8.54
|
8.93
|
|
Quartile Ranking
|
4
|
2
|
1
|
2
|
1
|
3
|
1
|
-
|
|
Calendar Return (%)
|
2023
|
2022
|
2021
|
2020
|
2019
|
2018
|
2017
|
2016
|
2015
|
2014
|
|
Fund
|
17.39
|
-18.90
|
22.40
|
9.70
|
38.76
|
-1.39
|
-
|
-
|
-
|
-
|
|
Benchmark
|
13.41
|
-5.68
|
22.05
|
-5.24
|
19.43
|
-4.99
|
15.24
|
6.34
|
14.20
|
14.35
|
|
Quartile Ranking
|
1
|
4
|
4
|
1
|
1
|
1
|
-
|
-
|
-
|
-
|