|
Evolve Cyber Security Index Fund (CYBR)-Hedged
|
As of March 31, 2024
|
|
(Sector Equity)
|
|
Underlying Index
|
Solactive Global Cyber Security Index
|
Inception Return
(9/18/2017)
|
14.32 %
|
|
Day High/Low
|
$44.56 / $44.19
|
|
YTD Return
|
6.45 %
|
|
52Week High/Low
|
$50.27 / $31.45
|
|
|
|
|
|
NAVPS
(4/17/2024)
|
$44.10
|
|
Change
|
 $-0.38 / -0.86 %
|
Open / Close
(4/17/2024)
|
$44.42
/
$44.19
|
|
|
|
Management Fee
|
0.40 %
|
|
Traded Volume
|
6,127
|
|
Assets ($mil)
|
-
|
|
Rank (1Yr)
|
55/177
|
|
Std Dev (3Yr)
|
25.34 %
|
|
Beta (3Yr)
|
0.90
|
|
Volatility Ranking (3Yr)
|
10/10
|
|
RRSP Eligibility
|
Yes
|
|
Open to Invest
|
Open
|
|
Annual Dividend
|
$0.12
|
|
Annual Yield
|
0.27 %
|
|
|
Objective
The Fund seeks to replicate, to the extent reasonably possible and before fees and expenses, the performance of the Solactive Global Cyber Security Index Hedged, or any successor thereto. The Fund invests primarily in equity securities of companies located domestically or internationally that are involved in the cyber security industry through hardware and software development.
|
Fund Manager
Evolve Funds Group Inc.
Portfolio Manager
Evolve Funds Group Inc.
Sub-Advisor
Data not available
|
|
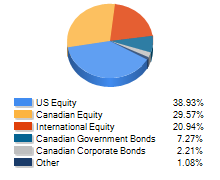
Asset Allocation
(As of March 31, 2024)
|
Sector Allocation
(As of March 31, 2024)
|
Geographic Allocation
(As of March 31, 2024)
|
Top 10 Holdings
| Name | Asset | Sector | Geographic | Percent |
| Okta Inc Cl A | US Equity | Technology | United States | 8.99% |
| Booz Allen Hamilton Holding Corp Cl A | US Equity | Technology | United States | 8.34% |
| Crowdstrike Holdings Inc Cl A | US Equity | Technology | United States | 8.13% |
| Fortinet Inc | US Equity | Technology | United States | 7.89% |
| Check Point Software Technologies Ltd | International Equity | Industrial Services | Africa and Middle East | 7.45% |
| Cyberark Software Ltd | International Equity | Technology | Africa and Middle East | 6.71% |
| Palo Alto Networks Inc | US Equity | Technology | United States | 6.29% |
| Zscaler Inc | US Equity | Technology | United States | 6.02% |
| CACI International Inc Cl A | US Equity | Technology | United States | 5.19% |
| Trend Micro Inc | International Equity | Technology | Japan | 4.64% |
Performance Data
(As of March 31, 2024)
|
|
Return (%)
|
Annualized Return (%)
|
|
Return
|
1
Mth
|
3
Mth
|
6
Mth
|
YTD
|
1
Yr
|
3
Yr
|
5
Yr
|
10
Yr
|
|
Fund
|
-3.14
|
6.45
|
26.52
|
6.45
|
35.00
|
3.64
|
11.44
|
-
|
|
Benchmark
|
4.14
|
6.62
|
15.26
|
6.62
|
13.96
|
9.11
|
9.96
|
7.67
|
|
Quartile Ranking
|
4
|
4
|
2
|
4
|
2
|
3
|
2
|
-
|
|
Calendar Return (%)
|
2023
|
2022
|
2021
|
2020
|
2019
|
2018
|
2017
|
2016
|
2015
|
2014
|
|
Fund
|
43.31
|
-36.63
|
5.71
|
65.60
|
24.68
|
9.01
|
-
|
-
|
-
|
-
|
|
Benchmark
|
11.75
|
-5.84
|
25.09
|
5.60
|
22.88
|
-8.89
|
9.10
|
21.08
|
-8.32
|
10.55
|
|
Quartile Ranking
|
2
|
4
|
4
|
1
|
2
|
1
|
-
|
-
|
-
|
-
|