|
Horizons NASDAQ-100 Index ETF U$ (HXQ.U)
|
As of March 31, 2024
|
|
(U.S. Equity)
|
|
FundGrade A+
® Rating recipient
For more information about FundGrade
click here
2022
2021
2020
2019
Underlying Index
|
NASDAQ-100® Index (Total Return)
|
Inception Return
(4/19/2016)
|
19.68 %
|
|
Day High/Low
|
$50.08 / $49.65
|
|
YTD Return
|
8.60 %
|
|
52Week High/Low
|
$52.68 / $36.22
|
|
|
|
|
|
NAVPS
(4/18/2024)
|
$49.68
|
|
Change
|
 $-0.28 / -0.57 %
|
Open / Close
(4/18/2024)
|
$49.98
/
$49.68
|
|
|
|
Management Fee
|
0.25 %
|
|
Traded Volume
|
2,021
|
|
Assets ($mil)
|
-
|
|
Rank (1Yr)
|
-
|
|
Std Dev (3Yr)
|
19.81 %
|
|
Beta (3Yr)
|
1.32
|
|
Volatility Ranking (3Yr)
|
10/10
|
|
RRSP Eligibility
|
Yes
|
|
Open to Invest
|
Open
|
|
Annual Dividend
|
-
|
|
Annual Yield
|
-
|
|
|
Objective
Horizons HXQ seeks to replicate, to the extent ossible, the performance of the NASDAQ 100 Index(Total Return), net of expenses.
|
Fund Manager
Horizons ETFs Management (Canada) Inc.
Portfolio Manager
Horizons ETFs Management (Canada) Inc.
Sub-Advisor
Data not available
|
|
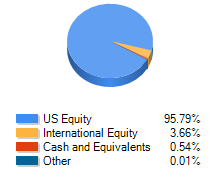
Asset Allocation
(As of March 31, 2024)
|
Sector Allocation
(As of March 31, 2024)
|
Geographic Allocation
(As of March 31, 2024)
|
Top 10 Holdings
| Name | Asset | Sector | Geographic | Percent |
| Microsoft Corp | US Equity | Technology | United States | 8.72% |
| Apple Inc | US Equity | Technology | United States | 7.38% |
| NVIDIA Corp | US Equity | Technology | United States | 6.32% |
| Amazon.com Inc | US Equity | Consumer Services | United States | 5.23% |
| Meta Platforms Inc Cl A | US Equity | Technology | United States | 4.73% |
| BROADCOM INC | Canadian Equity | Financial Services | Canada | 4.43% |
| Alphabet Inc Cl A | US Equity | Technology | United States | 2.48% |
| Alphabet Inc Cl C | US Equity | Technology | United States | 2.40% |
| Tesla Inc | US Equity | Consumer Goods | United States | 2.36% |
| Costco Wholesale Corp | US Equity | Consumer Services | United States | 2.34% |
Performance Data
(As of March 31, 2024)
|
|
Return (%)
|
Annualized Return (%)
|
|
Return
|
1
Mth
|
3
Mth
|
6
Mth
|
YTD
|
1
Yr
|
3
Yr
|
5
Yr
|
10
Yr
|
|
Fund
|
1.20
|
8.60
|
24.28
|
8.60
|
39.11
|
12.19
|
20.37
|
-
|
|
Benchmark
|
3.22
|
10.56
|
23.48
|
10.56
|
29.88
|
11.49
|
15.05
|
12.96
|
|
Quartile Ranking
|
-
|
-
|
-
|
-
|
-
|
-
|
-
|
-
|
|
Calendar Return (%)
|
2023
|
2022
|
2021
|
2020
|
2019
|
2018
|
2017
|
2016
|
2015
|
2014
|
|
Fund
|
54.48
|
-32.61
|
26.98
|
48.28
|
38.55
|
-0.61
|
32.11
|
-
|
-
|
-
|
|
Benchmark
|
26.29
|
-18.11
|
28.71
|
18.40
|
31.49
|
-4.38
|
21.83
|
11.96
|
1.38
|
13.69
|
|
Quartile Ranking
|
-
|
-
|
-
|
-
|
-
|
-
|
-
|
-
|
-
|
-
|