|
iShares Core MSCI All Cou Wld x Cda Ix ETF (XAW)
|
As of March 31, 2024
|
|
(Global Equity)
|
|
FundGrade A+
® Rating recipient
For more information about FundGrade
click here
Underlying Index
|
MSCI ACWI ex Canada IMI
|
Inception Return
(2/10/2015)
|
9.83 %
|
|
Day High/Low
|
$38.62 / $38.34
|
|
YTD Return
|
10.65 %
|
|
52Week High/Low
|
$39.94 / $32.75
|
|
|
|
|
|
NAVPS
(4/19/2024)
|
$38.36
|
|
Change
|
 $-0.28 / -0.73 %
|
Open / Close
(4/19/2024)
|
$38.59
/
$38.41
|
|
|
|
Management Fee
|
0.20 %
|
|
Traded Volume
|
38,915
|
|
Assets ($mil)
|
$2,464.72
|
|
Rank (1Yr)
|
551/1934
|
|
Std Dev (3Yr)
|
12.62 %
|
|
Beta (3Yr)
|
0.97
|
|
Volatility Ranking (3Yr)
|
7/10
|
|
RRSP Eligibility
|
Yes
|
|
Open to Invest
|
Open
|
|
Annual Dividend
|
$0.62
|
|
Annual Yield
|
1.60 %
|
|
|
Objective
The fund seeks to provide long-term capital growth by replicating, to the extent possible, the performance of the MSCI ACWI ex Canada IMI Index (the "Index"), net of expenses. The Index captures large, mid and small cap representation across 22 of 23 developed markets countries (excluding Canada) and 23 emerging markets countries. The Index covers approximately 99% of the global equity opportunity set outside Canada.
|
Fund Manager
BlackRock Asset Management Canada Limited
Portfolio Manager
BlackRock Asset Management Canada Limited
Sub-Advisor
BlackRock Institutional Trust Company, N.A.
|
|
Asset Allocation
(As of March 31, 2024)
|
Sector Allocation
(As of March 31, 2024)
|
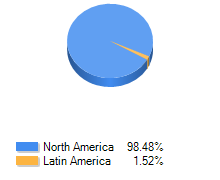
Geographic Allocation
(As of March 31, 2024)
|
Top 10 Holdings
| Name | Asset | Sector | Geographic | Percent |
| iShares Core S&P 500 ETF (IVV) | US Equity | Exchange Traded Fund | United States | 53.35% |
| iShares Core MSCI EAFE IMI Index ETF (XEF) | International Equity | Exchange Traded Fund | Multi-National | 25.16% |
| iShares Core MSCI Emerging Mkts IMI Idx ETF (XEC) | International Equity | Exchange Traded Fund | Multi-National | 10.94% |
| iShares Core S&P Total US Stock Market ETF (ITOT) | US Equity | Exchange Traded Fund | United States | 4.68% |
| iShares Core S&P Mid-Cap ETF (IJH) | US Equity | Exchange Traded Fund | United States | 3.76% |
| iShares Core S&P Small-Cap ETF (IJR) | US Equity | Exchange Traded Fund | United States | 2.11% |
Performance Data
(As of March 31, 2024)
|
|
Return (%)
|
Annualized Return (%)
|
|
Return
|
1
Mth
|
3
Mth
|
6
Mth
|
YTD
|
1
Yr
|
3
Yr
|
5
Yr
|
10
Yr
|
|
Fund
|
3.04
|
10.65
|
19.75
|
10.65
|
22.36
|
9.31
|
10.84
|
-
|
|
Benchmark
|
2.94
|
10.27
|
20.07
|
10.27
|
23.05
|
9.29
|
11.08
|
10.93
|
|
Quartile Ranking
|
2
|
2
|
2
|
2
|
2
|
1
|
1
|
-
|
|
Calendar Return (%)
|
2023
|
2022
|
2021
|
2020
|
2019
|
2018
|
2017
|
2016
|
2015
|
2014
|
|
Fund
|
18.16
|
-11.77
|
18.23
|
12.43
|
19.37
|
-1.74
|
15.88
|
5.39
|
-
|
-
|
|
Benchmark
|
19.37
|
-12.64
|
17.62
|
13.15
|
21.41
|
-1.79
|
16.29
|
5.18
|
16.88
|
13.97
|
|
Quartile Ranking
|
2
|
2
|
2
|
2
|
3
|
2
|
2
|
2
|
-
|
-
|