|
CI MStar Intl Value Index ETF (VXM.B)
|
As of March 31, 2024
|
|
(International Equity)
|
|
FundGrade A+
® Rating recipient
For more information about FundGrade
click here
Underlying Index
|
Morningstar® Developed Markets ex-North America Target Value Index
|
Inception Return
(11/13/2014)
|
6.70 %
|
|
Day High/Low
|
- / -
|
|
YTD Return
|
8.87 %
|
|
52Week High/Low
|
$30.30 / $23.24
|
|
|
|
|
|
NAVPS
(4/24/2024)
|
$29.95
|
|
Change
|
 $0.14 / 0.46 %
|
Open / Close
(4/24/2024)
|
-
/
$29.47
|
|
|
|
Management Fee
|
0.60 %
|
|
Traded Volume
|
67
|
|
Assets ($mil)
|
$268.82
|
|
Rank (1Yr)
|
59/742
|
|
Std Dev (3Yr)
|
16.23 %
|
|
Beta (3Yr)
|
1.10
|
|
Volatility Ranking (3Yr)
|
6/10
|
|
RRSP Eligibility
|
Yes
|
|
Open to Invest
|
Open
|
|
Annual Dividend
|
$1.03
|
|
Annual Yield
|
3.48 %
|
|
|
Objective
The CI Morningstar International Value Index ETF has been designed to replicate the performance of the Morningstar® Developed Markets ex-North America Target Value Index, net of expenses.
|
Fund Manager
CI Investments Inc
Portfolio Manager
CI Investments Inc
Sub-Advisor
Data not available
|
|
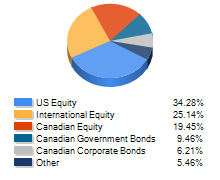
Asset Allocation
(As of March 31, 2024)
|
Sector Allocation
(As of March 31, 2024)
|
Geographic Allocation
(As of March 31, 2024)
|
Top 10 Holdings
| Name | Asset | Sector | Geographic | Percent |
| Yue Yuen Industrial (Holdings) Ltd | International Equity | Consumer Goods | Asia/Pacific Rim | 0.66% |
| Virgin Money UK PLC | International Equity | Financial Services | European Union | 0.64% |
| Rubis SCA | International Equity | Energy | European Union | 0.63% |
| First Pacific Co Ltd | International Equity | Consumer Goods | Asia/Pacific Rim | 0.58% |
| Renault SA | International Equity | Consumer Goods | European Union | 0.58% |
| TP ICAP Group PLC | International Equity | Financial Services | European Union | 0.57% |
| Banco Comercial Portugues SA | International Equity | Financial Services | European Union | 0.57% |
| Tokyo Electric Power Co Holdings Inc | International Equity | Utilities | Japan | 0.56% |
| Hokkaido Electric Power Co Inc | International Equity | Utilities | Japan | 0.56% |
| HeidelbergCement AG | International Equity | Industrial Goods | European Union | 0.56% |
Performance Data
(As of March 31, 2024)
|
|
Return (%)
|
Annualized Return (%)
|
|
Return
|
1
Mth
|
3
Mth
|
6
Mth
|
YTD
|
1
Yr
|
3
Yr
|
5
Yr
|
10
Yr
|
|
Fund
|
3.91
|
8.87
|
14.10
|
8.87
|
19.49
|
8.70
|
5.46
|
-
|
|
Benchmark
|
3.12
|
7.59
|
16.68
|
7.59
|
15.23
|
5.89
|
7.22
|
6.93
|
|
Quartile Ranking
|
1
|
2
|
3
|
2
|
1
|
1
|
3
|
-
|
|
Calendar Return (%)
|
2023
|
2022
|
2021
|
2020
|
2019
|
2018
|
2017
|
2016
|
2015
|
2014
|
|
Fund
|
18.47
|
-1.58
|
9.88
|
-11.22
|
10.02
|
-11.01
|
23.25
|
4.06
|
18.32
|
-
|
|
Benchmark
|
15.74
|
-10.67
|
8.97
|
8.01
|
16.27
|
-6.81
|
18.37
|
-1.70
|
19.41
|
4.12
|
|
Quartile Ranking
|
1
|
1
|
2
|
4
|
4
|
3
|
1
|
1
|
2
|
-
|