|
BMO MSCI All Country World Hi Quality Ix ETF (ZGQ)
|
As of March 31, 2024
|
|
(Global Equity)
|
|
FundGrade A+
® Rating recipient
For more information about FundGrade
click here
2022
2021
2020
2019
Underlying Index
|
MSCI All Country World High Quality Index
|
Inception Return
(11/5/2014)
|
14.30 %
|
|
Day High/Low
|
$61.42 / $61.14
|
|
YTD Return
|
13.68 %
|
|
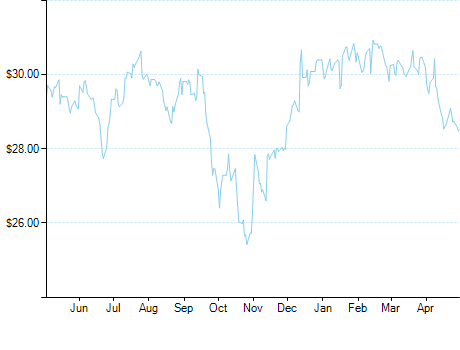
52Week High/Low
|
$63.68 / $47.50
|
|
|
|
|
|
NAVPS
(4/18/2024)
|
$61.04
|
|
Change
|
 $-0.13 / -0.21 %
|
Open / Close
(4/18/2024)
|
$61.42
/
$61.18
|
|
|
|
Management Fee
|
0.45 %
|
|
Traded Volume
|
3,758
|
|
Assets ($mil)
|
-
|
|
Rank (1Yr)
|
106/1934
|
|
Std Dev (3Yr)
|
13.53 %
|
|
Beta (3Yr)
|
0.97
|
|
Volatility Ranking (3Yr)
|
8/10
|
|
RRSP Eligibility
|
Yes
|
|
Open to Invest
|
Open
|
|
Annual Dividend
|
$0.76
|
|
Annual Yield
|
1.24 %
|
|
|
Objective
BMO MSCI All Country World High Quality Index ETF has been designed to replicate, to the extent possible, the performance of the MSCI All Country World High Quality Index, net of expenses.
|
Fund Manager
BMO Asset Management Inc.
Portfolio Manager
BMO Asset Management Inc.
Sub-Advisor
Data not available
|
|
Asset Allocation
(As of March 31, 2024)
|
Sector Allocation
(As of March 31, 2024)
|
Geographic Allocation
(As of March 31, 2024)
|
Top 10 Holdings
| Name | Asset | Sector | Geographic | Percent |
| NVIDIA Corp | US Equity | Technology | United States | 7.68% |
| Microsoft Corp | US Equity | Technology | United States | 4.78% |
| Meta Platforms Inc Cl A | US Equity | Technology | United States | 4.43% |
| Apple Inc | US Equity | Technology | United States | 3.84% |
| Eli Lilly and Co | US Equity | Healthcare | United States | 3.08% |
| Taiwan Semiconductor Manufactrg Co Ltd | International Equity | Technology | Asia/Pacific Rim | 2.90% |
| Visa Inc Cl A | US Equity | Financial Services | United States | 2.54% |
| Alphabet Inc Cl A | US Equity | Technology | United States | 2.51% |
| Novo Nordisk A/S Cl B | International Equity | Healthcare | European Union | 2.45% |
| Broadcom Inc | US Equity | Technology | United States | 2.43% |
Performance Data
(As of March 31, 2024)
|
|
Return (%)
|
Annualized Return (%)
|
|
Return
|
1
Mth
|
3
Mth
|
6
Mth
|
YTD
|
1
Yr
|
3
Yr
|
5
Yr
|
10
Yr
|
|
Fund
|
2.41
|
13.68
|
24.82
|
13.68
|
32.78
|
12.52
|
15.22
|
-
|
|
Benchmark
|
2.94
|
10.27
|
20.07
|
10.27
|
23.05
|
9.29
|
11.08
|
10.93
|
|
Quartile Ranking
|
3
|
1
|
1
|
1
|
1
|
1
|
1
|
-
|
|
Calendar Return (%)
|
2023
|
2022
|
2021
|
2020
|
2019
|
2018
|
2017
|
2016
|
2015
|
2014
|
|
Fund
|
29.23
|
-18.26
|
20.95
|
22.36
|
28.72
|
0.41
|
19.69
|
2.21
|
21.86
|
-
|
|
Benchmark
|
19.37
|
-12.64
|
17.62
|
13.15
|
21.41
|
-1.79
|
16.29
|
5.18
|
16.88
|
13.97
|
|
Quartile Ranking
|
1
|
4
|
1
|
1
|
1
|
1
|
1
|
3
|
1
|
-
|