|
CI U.S. & Cda Lifeco Cov Call ETF (Hgd Com) (FLI)
|
As of March 31, 2024
|
|
(Financial Services Equity)
|
|
Underlying Index
|
|
Inception Return
(8/22/2013)
|
8.36 %
|
|
Day High/Low
|
$9.87 / $9.76
|
|
YTD Return
|
9.00 %
|
|
52Week High/Low
|
$10.61 / $7.70
|
|
|
|
|
|
NAVPS
(4/24/2024)
|
$9.87
|
|
Change
|
 $0.05 / 0.48 %
|
Open / Close
(4/24/2024)
|
$9.76
/
$9.85
|
|
|
|
Management Fee
|
0.75 %
|
|
Traded Volume
|
617
|
|
Assets ($mil)
|
$86.63
|
|
Rank (1Yr)
|
25/71
|
|
Std Dev (3Yr)
|
26.68 %
|
|
Beta (3Yr)
|
1.56
|
|
Volatility Ranking (3Yr)
|
9/10
|
|
RRSP Eligibility
|
Yes
|
|
Open to Invest
|
Open
|
|
Annual Dividend
|
$0.71
|
|
Annual Yield
|
7.20 %
|
|
|
Objective
The Fund's investment objectives are to provide holders of Units (the "Holders") with:(i) quarterly cash distributions;(ii) the opportunity for capital appreciation; and(iii) lower overall volatility of Portfolio returns than would be experienced by owning a portfolio of common equity securities of LifeCo Companies directly.
|
Fund Manager
CI Investments Inc
Portfolio Manager
CI Investments Inc
Sub-Advisor
Data not available
|
|
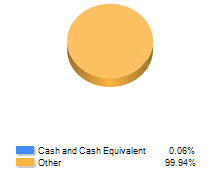
Asset Allocation
(As of March 31, 2024)
|
Sector Allocation
(As of March 31, 2024)
|
Geographic Allocation
(As of March 31, 2024)
|
Top 10 Holdings
| Name | Asset | Sector | Geographic | Percent |
| Lincoln National Corp | US Equity | Financial Services | United States | 10.90% |
| Unum Group | US Equity | Financial Services | United States | 10.82% |
| Manulife Financial Corp | Canadian Equity | Financial Services | Canada | 10.63% |
| Prudential Financial Inc | US Equity | Financial Services | United States | 10.59% |
| Principal Financial Group Inc | US Equity | Financial Services | United States | 10.18% |
| MetLife Inc | US Equity | Financial Services | United States | 10.03% |
| Sun Life Financial Inc | Canadian Equity | Financial Services | Canada | 9.88% |
| Aflac Inc | US Equity | Financial Services | United States | 9.46% |
| Great-West Lifeco Inc | Canadian Equity | Financial Services | Canada | 9.40% |
| Globe Life Inc | US Equity | Financial Services | United States | 9.00% |
Performance Data
(As of March 31, 2024)
|
|
Return (%)
|
Annualized Return (%)
|
|
Return
|
1
Mth
|
3
Mth
|
6
Mth
|
YTD
|
1
Yr
|
3
Yr
|
5
Yr
|
10
Yr
|
|
Fund
|
4.66
|
9.00
|
16.45
|
9.00
|
26.76
|
9.89
|
8.01
|
7.27
|
|
Benchmark
|
3.76
|
9.87
|
21.36
|
9.87
|
25.68
|
9.79
|
8.54
|
8.93
|
|
Quartile Ranking
|
3
|
2
|
3
|
2
|
2
|
1
|
3
|
4
|
|
Calendar Return (%)
|
2023
|
2022
|
2021
|
2020
|
2019
|
2018
|
2017
|
2016
|
2015
|
2014
|
|
Fund
|
6.69
|
5.33
|
25.35
|
-12.00
|
20.03
|
-19.51
|
11.24
|
20.43
|
5.80
|
10.10
|
|
Benchmark
|
13.41
|
-5.68
|
22.05
|
-5.24
|
19.43
|
-4.99
|
15.24
|
6.34
|
14.20
|
14.35
|
|
Quartile Ranking
|
4
|
1
|
3
|
4
|
2
|
4
|
3
|
2
|
2
|
4
|