|
Invesco FTSE RAFI Canadian Index ETF (PXC)
|
As of March 31, 2024
|
|
(Canadian Equity)
|
|
FundGrade A+
® Rating recipient
For more information about FundGrade
click here
2022
Underlying Index
|
FTSE RAFI Canada Index
|
Inception Return
(1/26/2012)
|
8.68 %
|
|
Day High/Low
|
$36.62 / $36.62
|
|
YTD Return
|
7.05 %
|
|
52Week High/Low
|
$37.97 / $32.00
|
|
|
|
|
|
NAVPS
(4/18/2024)
|
$36.67
|
|
Change
|
 $0.14 / 0.39 %
|
Open / Close
(4/18/2024)
|
$36.62
/
$36.62
|
|
|
|
Management Fee
|
0.45 %
|
|
Traded Volume
|
1,000
|
|
Assets ($mil)
|
$179.76
|
|
Rank (1Yr)
|
202/701
|
|
Std Dev (3Yr)
|
18.56 %
|
|
Beta (3Yr)
|
1.09
|
|
Volatility Ranking (3Yr)
|
7/10
|
|
RRSP Eligibility
|
Yes
|
|
Open to Invest
|
Open
|
|
Annual Dividend
|
$1.30
|
|
Annual Yield
|
3.55 %
|
|
|
Objective
PXC seeks to replicate, to the extent reasonably possible and before fees and expenses, the performance of the FTSE RAFI® Canada Index, or any successor thereto. This Invesco ETF invests, directly or indirectly, primarily in Canadian equity securities.
|
Fund Manager
Invesco Canada Ltd.
Portfolio Manager
Invesco Canada Ltd.
Sub-Advisor
Invesco Capital Management LLC
|
|
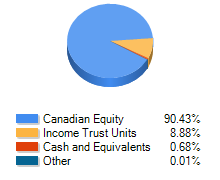
Asset Allocation
(As of March 31, 2024)
|
Sector Allocation
(As of March 31, 2024)
|
Geographic Allocation
(As of March 31, 2024)
|
Top 10 Holdings
| Name | Asset | Sector | Geographic | Percent |
| Royal Bank of Canada | Canadian Equity | Financial Services | Canada | 7.55% |
| Toronto-Dominion Bank | Canadian Equity | Financial Services | Canada | 6.91% |
| Bank of Nova Scotia | Canadian Equity | Financial Services | Canada | 5.62% |
| Enbridge Inc | Canadian Equity | Energy | Canada | 5.58% |
| Bank of Montreal | Canadian Equity | Financial Services | Canada | 4.18% |
| Canadian Natural Resources Ltd | Canadian Equity | Energy | Canada | 4.04% |
| Brookfield Corp Cl A | Canadian Equity | Financial Services | Canada | 3.93% |
| Suncor Energy Inc | Canadian Equity | Energy | Canada | 3.82% |
| Canadian Imperial Bank of Commerce | Canadian Equity | Financial Services | Canada | 3.48% |
| Manulife Financial Corp | Canadian Equity | Financial Services | Canada | 3.31% |
Performance Data
(As of March 31, 2024)
|
|
Return (%)
|
Annualized Return (%)
|
|
Return
|
1
Mth
|
3
Mth
|
6
Mth
|
YTD
|
1
Yr
|
3
Yr
|
5
Yr
|
10
Yr
|
|
Fund
|
4.57
|
7.05
|
15.32
|
7.05
|
14.29
|
12.25
|
10.85
|
7.82
|
|
Benchmark
|
4.14
|
6.62
|
15.26
|
6.62
|
13.96
|
9.11
|
9.96
|
7.67
|
|
Quartile Ranking
|
1
|
1
|
2
|
1
|
2
|
1
|
1
|
2
|
|
Calendar Return (%)
|
2023
|
2022
|
2021
|
2020
|
2019
|
2018
|
2017
|
2016
|
2015
|
2014
|
|
Fund
|
10.03
|
1.19
|
35.03
|
-3.27
|
20.12
|
-10.07
|
7.59
|
29.99
|
-10.99
|
6.78
|
|
Benchmark
|
11.75
|
-5.84
|
25.09
|
5.60
|
22.88
|
-8.89
|
9.10
|
21.08
|
-8.32
|
10.55
|
|
Quartile Ranking
|
3
|
1
|
1
|
4
|
3
|
3
|
2
|
1
|
4
|
4
|