|
iShares S&P/TSX Global Base Metals Index ETF (XBM)
|
As of March 31, 2024
|
|
(Natural Resources Equity)
|
|
FundGrade A+
® Rating recipient
For more information about FundGrade
click here
2018
Underlying Index
|
S&P/TSX Global Base Metals Index
|
Inception Return
(4/12/2011)
|
2.85 %
|
|
Day High/Low
|
$21.70 / $21.30
|
|
YTD Return
|
8.38 %
|
|
52Week High/Low
|
$22.68 / $16.33
|
|
|
|
|
|
NAVPS
(4/22/2024)
|
$21.64
|
|
Change
|
 $-0.20 / -0.92 %
|
Open / Close
(4/22/2024)
|
$21.49
/
$21.63
|
|
|
|
Management Fee
|
0.55 %
|
|
Traded Volume
|
23,647
|
|
Assets ($mil)
|
$224.96
|
|
Rank (1Yr)
|
94/117
|
|
Std Dev (3Yr)
|
32.12 %
|
|
Beta (3Yr)
|
0.94
|
|
Volatility Ranking (3Yr)
|
10/10
|
|
RRSP Eligibility
|
Yes
|
|
Open to Invest
|
Open
|
|
Annual Dividend
|
$0.40
|
|
Annual Yield
|
1.83 %
|
|
|
Objective
The iShares S&P/TSX Global Base Metals Index Fund seeks to provide long-term capital growth by replicating, to the extent possible, the performance of the S&P/TSX Global Base Metals Index, net of expenses.
|
Fund Manager
BlackRock Asset Management Canada Limited
Portfolio Manager
BlackRock Asset Management Canada Limited
Sub-Advisor
BlackRock Institutional Trust Company, N.A.
|
|
Asset Allocation
(As of March 31, 2024)
|
Sector Allocation
(As of March 31, 2024)
|
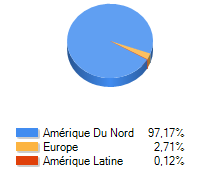
Geographic Allocation
(As of March 31, 2024)
|
Top 10 Holdings
| Name | Asset | Sector | Geographic | Percent |
| Freeport-McMoRan Inc | US Equity | Basic Materials | United States | 10.74% |
| Teck Resources Ltd Cl B | Canadian Equity | Basic Materials | Canada | 10.14% |
| Rio Tinto PLC - ADR | International Equity | Basic Materials | European Union | 9.11% |
| BHP Group Ltd - ADR | International Equity | Basic Materials | Asia/Pacific Rim | 9.08% |
| Southern Copper Corp | US Equity | Basic Materials | United States | 8.66% |
| First Quantum Minerals Ltd | Canadian Equity | Basic Materials | Canada | 7.29% |
| Ivanhoe Mines Ltd Cl A | Canadian Equity | Basic Materials | Canada | 6.81% |
| Lundin Mining Corp | Canadian Equity | Basic Materials | Canada | 6.44% |
| Alcoa Corp | US Equity | Basic Materials | United States | 5.77% |
| Capstone Copper Corp | Canadian Equity | Basic Materials | Canada | 2.93% |
Performance Data
(As of March 31, 2024)
|
|
Return (%)
|
Annualized Return (%)
|
|
Return
|
1
Mth
|
3
Mth
|
6
Mth
|
YTD
|
1
Yr
|
3
Yr
|
5
Yr
|
10
Yr
|
|
Fund
|
15.09
|
8.38
|
8.56
|
8.38
|
3.00
|
10.75
|
13.29
|
7.18
|
|
Benchmark
|
10.75
|
8.69
|
8.09
|
8.69
|
5.74
|
12.02
|
8.22
|
2.10
|
|
Quartile Ranking
|
1
|
2
|
1
|
2
|
4
|
4
|
3
|
1
|
|
Calendar Return (%)
|
2023
|
2022
|
2021
|
2020
|
2019
|
2018
|
2017
|
2016
|
2015
|
2014
|
|
Fund
|
2.57
|
3.95
|
31.59
|
31.34
|
9.08
|
-21.48
|
32.27
|
53.46
|
-34.79
|
-8.30
|
|
Benchmark
|
-0.78
|
12.86
|
21.57
|
-7.01
|
20.06
|
-15.86
|
-1.69
|
36.74
|
-23.78
|
-5.59
|
|
Quartile Ranking
|
2
|
4
|
3
|
1
|
3
|
3
|
1
|
1
|
4
|
2
|