|
iShares S&P/TSX Composite Hi Dividend Ix ETF (XEI)
|
As of March 31, 2024
|
|
(Canadian Dividend & Income Equity)
|
|
Underlying Index
|
S&P/TSX Composite High Dividend Index
|
Inception Return
(4/12/2011)
|
6.84 %
|
|
Day High/Low
|
$24.69 / $24.51
|
|
YTD Return
|
4.27 %
|
|
52Week High/Low
|
$25.94 / $22.31
|
|
|
|
|
|
NAVPS
(4/18/2024)
|
$24.63
|
|
Change
|
 $0.11 / 0.46 %
|
Open / Close
(4/18/2024)
|
$24.57
/
$24.62
|
|
|
|
Management Fee
|
0.20 %
|
|
Traded Volume
|
57,457
|
|
Assets ($mil)
|
$1,603.35
|
|
Rank (1Yr)
|
396/448
|
|
Std Dev (3Yr)
|
19.48 %
|
|
Beta (3Yr)
|
1.13
|
|
Volatility Ranking (3Yr)
|
7/10
|
|
RRSP Eligibility
|
Yes
|
|
Open to Invest
|
Open
|
|
Annual Dividend
|
$1.32
|
|
Annual Yield
|
5.35 %
|
|
|
Objective
The iShares S&P/TSX Equity Income Index Fund seeks to provide long-term capital growth by replicating, to the extent possible, the performance of the S&P/TSX Equity Income Index, net of expenses.
|
Fund Manager
BlackRock Asset Management Canada Limited
Portfolio Manager
BlackRock Asset Management Canada Limited
Sub-Advisor
BlackRock Institutional Trust Company, N.A.
|
|
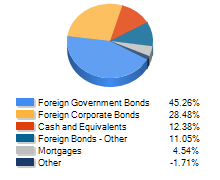
Asset Allocation
(As of March 31, 2024)
|
Sector Allocation
(As of March 31, 2024)
|
Geographic Allocation
(As of March 31, 2024)
|
Top 10 Holdings
| Name | Asset | Sector | Geographic | Percent |
| Suncor Energy Inc | Canadian Equity | Energy | Canada | 5.28% |
| Canadian Natural Resources Ltd | Canadian Equity | Energy | Canada | 5.27% |
| Royal Bank of Canada | Canadian Equity | Financial Services | Canada | 5.05% |
| Enbridge Inc | Canadian Equity | Energy | Canada | 5.04% |
| Nutrien Ltd | Canadian Equity | Basic Materials | Canada | 5.04% |
| TC Energy Corp | Canadian Equity | Energy | Canada | 4.97% |
| Toronto-Dominion Bank | Canadian Equity | Financial Services | Canada | 4.95% |
| BCE Inc | Canadian Equity | Telecommunications | Canada | 4.61% |
| Bank of Montreal | Canadian Equity | Financial Services | Canada | 4.56% |
| Telus Corp | Canadian Equity | Telecommunications | Canada | 4.51% |
Performance Data
(As of March 31, 2024)
|
|
Return (%)
|
Annualized Return (%)
|
|
Return
|
1
Mth
|
3
Mth
|
6
Mth
|
YTD
|
1
Yr
|
3
Yr
|
5
Yr
|
10
Yr
|
|
Fund
|
3.61
|
4.27
|
11.84
|
4.27
|
7.78
|
9.88
|
9.02
|
6.25
|
|
Benchmark
|
4.14
|
6.62
|
15.26
|
6.62
|
13.96
|
9.11
|
9.96
|
7.67
|
|
Quartile Ranking
|
1
|
4
|
4
|
4
|
4
|
1
|
2
|
3
|
|
Calendar Return (%)
|
2023
|
2022
|
2021
|
2020
|
2019
|
2018
|
2017
|
2016
|
2015
|
2014
|
|
Fund
|
6.74
|
0.45
|
35.65
|
-7.56
|
25.43
|
-10.82
|
7.37
|
28.20
|
-14.67
|
4.89
|
|
Benchmark
|
11.75
|
-5.84
|
25.09
|
5.60
|
22.88
|
-8.89
|
9.10
|
21.08
|
-8.32
|
10.55
|
|
Quartile Ranking
|
3
|
1
|
1
|
4
|
1
|
4
|
3
|
1
|
4
|
4
|