|
Horizons Gold Producer Equity Cov Call ETF (GLCC)
|
As of March 31, 2024
|
|
(Precious Metals Equity)
|
|
Underlying Index
|
|
Inception Return
(4/11/2011)
|
-1.65 %
|
|
Day High/Low
|
$25.40 / $25.16
|
|
YTD Return
|
2.04 %
|
|
52Week High/Low
|
$29.49 / $19.22
|
|
|
|
|
|
NAVPS
(4/18/2024)
|
$25.25
|
|
Change
|
 $0.09 / 0.36 %
|
Open / Close
(4/18/2024)
|
$25.40
/
$25.25
|
|
|
|
Management Fee
|
0.65 %
|
|
Traded Volume
|
5,304
|
|
Assets ($mil)
|
-
|
|
Rank (1Yr)
|
27/77
|
|
Std Dev (3Yr)
|
32.06 %
|
|
Beta (3Yr)
|
0.91
|
|
Volatility Ranking (3Yr)
|
10/10
|
|
RRSP Eligibility
|
Yes
|
|
Open to Invest
|
Open
|
|
Annual Dividend
|
$2.64
|
|
Annual Yield
|
10.46 %
|
|
|
Objective
The investment objective of HEP is to provide unitholders with: (a) exposure to the performance of an equal weighted portfolio of North American based gold mining and exploration companies; and (b) monthly distributions of dividend and call option income. Any foreign currency gains or losses as a result of HEP's investment in non-Canadian issuers will be hedged back to the Canadian dollar to the best of its ability.
|
Fund Manager
Horizons ETFs Management (Canada) Inc.
Portfolio Manager
Horizons ETFs Management (Canada) Inc.
Sub-Advisor
Data not available
|
|
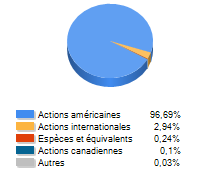
Asset Allocation
(As of March 31, 2024)
|
Sector Allocation
(As of March 31, 2024)
|
Geographic Allocation
(As of March 31, 2024)
|
Top 10 Holdings
| Name | Asset | Sector | Geographic | Percent |
| Agnico Eagle Mines Ltd | Canadian Equity | Basic Materials | Canada | 10.25% |
| Barrick Gold Corp | Canadian Equity | Basic Materials | Canada | 10.02% |
| Kinross Gold Corp | Canadian Equity | Basic Materials | Canada | 9.96% |
| Newmont Corp | US Equity | Basic Materials | United States | 9.74% |
| Gold Fields Ltd - ADR | International Equity | Basic Materials | Africa and Middle East | 9.62% |
| AngloGold Ashanti Ltd | International Equity | Basic Materials | Africa and Middle East | 9.29% |
| Alamos Gold Inc Cl A | Canadian Equity | Basic Materials | Canada | 7.74% |
| Pan American Silver Corp | Canadian Equity | Basic Materials | Canada | 7.27% |
| Harmony Gold Mining Co Ltd - ADR | International Equity | Basic Materials | Africa and Middle East | 6.70% |
| Endeavour Mining PLC | International Equity | Basic Materials | European Union | 6.59% |
Performance Data
(As of March 31, 2024)
|
|
Return (%)
|
Annualized Return (%)
|
|
Return
|
1
Mth
|
3
Mth
|
6
Mth
|
YTD
|
1
Yr
|
3
Yr
|
5
Yr
|
10
Yr
|
|
Fund
|
19.58
|
2.04
|
18.90
|
2.04
|
-0.33
|
2.67
|
7.40
|
5.65
|
|
Benchmark
|
18.87
|
2.02
|
15.68
|
2.02
|
-5.10
|
0.90
|
9.72
|
5.03
|
|
Quartile Ranking
|
2
|
3
|
2
|
3
|
2
|
3
|
4
|
3
|
|
Calendar Return (%)
|
2023
|
2022
|
2021
|
2020
|
2019
|
2018
|
2017
|
2016
|
2015
|
2014
|
|
Fund
|
6.35
|
-1.95
|
-9.32
|
15.05
|
38.40
|
-0.14
|
7.37
|
41.97
|
-11.00
|
-9.90
|
|
Benchmark
|
1.85
|
-2.48
|
-7.16
|
25.38
|
42.02
|
-3.46
|
0.96
|
55.11
|
-17.99
|
-14.81
|
|
Quartile Ranking
|
1
|
1
|
3
|
4
|
3
|
1
|
1
|
4
|
4
|
4
|