|
SPDR S&P Emerging Asia Pacific ETF (GMF)
|
Data not available
|
|
(Asia Pacific ex-Japan Equity)
|
|
Underlying Index
|
S&P Asia Pacific Emerging BMI Index
|
Inception Return
(3/23/2007)
|
-
|
|
Day High/Low
|
$101.38 / $101.09
|
|
YTD Return
|
-
|
|
52Week High/Low
|
$106.03 / $93.51
|
|
|
|
|
|
NAVPS
()
|
-
|
|
Change
|
 - / -
- / -
|
Open / Close
(4/19/2024)
|
$101.25
/
$101.15
|
|
|
|
Management Fee
|
-
|
|
Traded Volume
|
4,199
|
|
Assets ($mil)
|
-
|
|
Rank (1Yr)
|
-
|
|
Std Dev (3Yr)
|
-
|
|
Beta (3Yr)
|
-
|
|
Volatility Ranking (3Yr)
|
-
|
|
RRSP Eligibility
|
Yes
|
|
Open to Invest
|
Open
|
|
Annual Dividend
|
$2.78
|
|
Annual Yield
|
2.74 %
|
|
|
Objective
SPDR S&P Emerging Asia Pacific ETF is an exchange-traded fund incorporated in the USA. The Fund's objective is to replicate the performance of the S&P Asia Pacific Emerging BMI Index which includes companies in an emerging market in the Asia Pacific Emerging region.
|
Fund Manager
Data not available
Portfolio Manager
Data not available
Sub-Advisor
Data not available
|
|
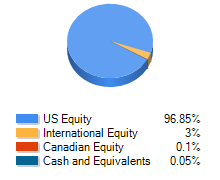
Asset Allocation
(As of March 31, 2024)
|
Sector Allocation
(As of March 31, 2024)
|
Geographic Allocation
(As of March 31, 2024)
|
Top 10 Holdings
| Name | Asset | Sector | Geographic | Percent |
| Taiwan Semiconductor Manufactrg Co Ltd - ADR | International Equity | Technology | Asia/Pacific Rim | 7.94% |
| Tencent Holdings Ltd | International Equity | Technology | Asia/Pacific Rim | 3.80% |
| Alibaba Group Holding Ltd | International Equity | Technology | Asia/Pacific Rim | 2.07% |
| Reliance Industries Ltd - GDR | International Equity | Energy | Other Asian | 1.89% |
| HDFC Bank Ltd | International Equity | Financial Services | Other Asian | 1.54% |
| Taiwan Semiconductor Manufactrg Co Ltd | International Equity | Technology | Asia/Pacific Rim | 1.38% |
| Pinduoduo Inc - ADR | International Equity | Consumer Services | Asia/Pacific Rim | 1.24% |
| ICICI Bank Ltd - ADR | International Equity | Financial Services | Other Asian | 1.21% |
| Hon Hai Precision Industry Co Ltd | International Equity | Technology | Asia/Pacific Rim | 1.13% |
| MediaTek Inc | International Equity | Technology | Asia/Pacific Rim | 1.02% |
Performance Data
(Data not available)
|
|
Return (%)
|
Annualized Return (%)
|
|
Return
|
1
Mth
|
3
Mth
|
6
Mth
|
YTD
|
1
Yr
|
3
Yr
|
5
Yr
|
10
Yr
|
|
Fund
|
-
|
-
|
-
|
-
|
-
|
-
|
-
|
-
|
|
Benchmark
|
2.05
|
1.54
|
9.62
|
1.54
|
6.36
|
-4.13
|
3.61
|
4.47
|
|
Quartile Ranking
|
-
|
-
|
-
|
-
|
-
|
-
|
-
|
-
|
|
Calendar Return (%)
|
2023
|
2022
|
2021
|
2020
|
2019
|
2018
|
2017
|
2016
|
2015
|
2014
|
|
Fund
|
-
|
-
|
-
|
-
|
-
|
-
|
-
|
-
|
-
|
-
|
|
Benchmark
|
8.74
|
-17.90
|
0.08
|
22.69
|
18.91
|
-13.96
|
36.37
|
5.77
|
-7.57
|
3.21
|
|
Quartile Ranking
|
-
|
-
|
-
|
-
|
-
|
-
|
-
|
-
|
-
|
-
|