|
iShares S&P/TSX Global Gold Index ETF (XGD)
|
As of March 31, 2024
|
|
(Precious Metals Equity)
|
|
Underlying Index
|
S&P/TSX Global Gold Index
|
Inception Return
(3/23/2001)
|
4.97 %
|
|
Day High/Low
|
$19.75 / $19.47
|
|
YTD Return
|
2.60 %
|
|
52Week High/Low
|
$21.67 / $14.93
|
|
|
|
|
|
NAVPS
(4/18/2024)
|
$19.63
|
|
Change
|
 $0.09 / 0.45 %
|
Open / Close
(4/18/2024)
|
$19.71
/
$19.62
|
|
|
|
Management Fee
|
0.55 %
|
|
Traded Volume
|
312,215
|
|
Assets ($mil)
|
$1,132.10
|
|
Rank (1Yr)
|
54/77
|
|
Std Dev (3Yr)
|
34.80 %
|
|
Beta (3Yr)
|
1.00
|
|
Volatility Ranking (3Yr)
|
10/10
|
|
RRSP Eligibility
|
Yes
|
|
Open to Invest
|
Open
|
|
Annual Dividend
|
$0.26
|
|
Annual Yield
|
1.35 %
|
|
|
Objective
The iShares International Mining Sector Funds seek to provide long-term capital growth by replicating, to the extent possible, the performance of the applicable International Mining Sector Index, net of expenses.
|
Fund Manager
BlackRock Asset Management Canada Limited
Portfolio Manager
BlackRock Asset Management Canada Limited
Sub-Advisor
BlackRock Institutional Trust Company, N.A.
|
|
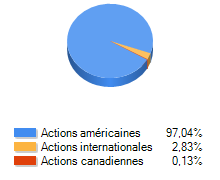
Asset Allocation
(As of March 31, 2024)
|
Sector Allocation
(As of March 31, 2024)
|
Geographic Allocation
(As of March 31, 2024)
|
Top 10 Holdings
| Name | Asset | Sector | Geographic | Percent |
| Newmont Corp | US Equity | Basic Materials | United States | 17.58% |
| Agnico Eagle Mines Ltd | Canadian Equity | Basic Materials | Canada | 12.64% |
| Barrick Gold Corp | Canadian Equity | Basic Materials | Canada | 12.44% |
| Franco-Nevada Corp | Canadian Equity | Basic Materials | Canada | 9.76% |
| Wheaton Precious Metals Corp | Canadian Equity | Basic Materials | Canada | 9.09% |
| Gold Fields Ltd - ADR | International Equity | Basic Materials | Africa and Middle East | 6.04% |
| AngloGold Ashanti Ltd | International Equity | Basic Materials | Africa and Middle East | 3.97% |
| Royal Gold Inc | US Equity | Basic Materials | United States | 3.41% |
| Kinross Gold Corp | Canadian Equity | Basic Materials | Canada | 3.21% |
| Alamos Gold Inc Cl A | Canadian Equity | Basic Materials | Canada | 2.49% |
Performance Data
(As of March 31, 2024)
|
|
Return (%)
|
Annualized Return (%)
|
|
Return
|
1
Mth
|
3
Mth
|
6
Mth
|
YTD
|
1
Yr
|
3
Yr
|
5
Yr
|
10
Yr
|
|
Fund
|
18.47
|
2.60
|
15.84
|
2.60
|
-4.25
|
2.22
|
9.52
|
5.65
|
|
Benchmark
|
18.87
|
2.02
|
15.68
|
2.02
|
-5.10
|
0.90
|
9.72
|
5.03
|
|
Quartile Ranking
|
3
|
3
|
3
|
3
|
3
|
3
|
3
|
3
|
|
Calendar Return (%)
|
2023
|
2022
|
2021
|
2020
|
2019
|
2018
|
2017
|
2016
|
2015
|
2014
|
|
Fund
|
3.74
|
-2.99
|
-6.04
|
21.30
|
40.33
|
-4.06
|
0.80
|
49.96
|
-10.54
|
-6.30
|
|
Benchmark
|
1.85
|
-2.48
|
-7.16
|
25.38
|
42.02
|
-3.46
|
0.96
|
55.11
|
-17.99
|
-14.81
|
|
Quartile Ranking
|
3
|
1
|
3
|
4
|
3
|
1
|
3
|
4
|
4
|
4
|